A Few Thoughts on Azerbaijan's Presidential Election
As expected, President Ilham Aliyev was awarded a third term in office after Azerbaijan's Central Electoral Commission announced his convincing victory (officially garnering 84.55% of the vote). The OSCE issued a strong statement challenging the democratic qualities of the process which the CEC deemed an "insult." Delegations from the CIS, Pakistan, and others indicated that the process was democratic. PACE statements came under scrutiny, especially on Twitter and among bloggers, with Rebecca Vincent's excellent Al Jazeera post noting the differences in professional credentials between OSCE and PACE delegations. Several other bloggers, including Arzu Geybullayeva and Katy Pearce and Farid Guliyev at the Monkey Cage, provided valuable accounts of the election process and its implications. A PR firm even weighed in at the Monkey Cage to express concerns about the lack of attention directed to Azerbaijan's "progress" in its elections.
In this post, I return to a few questions that I posed on election eve and provide a preliminary assessment of the data. OSCE reports, which tend to be based on the most thorough data collection efforts among international observation organizations,* suggest that fraud was evidenced among officials in the election apparatus, and also among citizens via vote buying and other forms of improper voting.
Turnout
Turnout not only provides a sense of citizen participation, but can also provide some evidence of malfeasance. If ballot boxes are being stuffed, or voters are being directed in "carousels", turnout will be inflated. The official turnout at the national level was 72.31%, according to the CEC. The average turnout at the polling station level was 74.4%. Of the 5,492 polling stations, 68 (1.2%) reported 100% turnout and 177 (3.2%) reported 95% or higher turnout. These results are consistent with the 2008 presidential elections.
The figure above shows the distribution of turnout across all polling stations at each reporting period on election day. At 10:00 a.m. and at noon, the distributions are bimodal, with the major mode centered around 20% and 40%, and minor modes around ten percentage points lower. As the day progresses, the distributions smooth out. The most interesting transformation is between 5:00 pm and the close of the polling stations at 7:00 p.m. The mean at closing is slightly higher than at 5:00 pm, but variance increases and a "hump" appears close to 100%. Could all of these changes happen naturally? Many of them could, especially if voters continued to come to the polls throughout the day. My cursory scan of webcams in the late afternoon showed little activity, but I was not able to systematically assess traffic. In principle, voters could have continued coming to the polls, altering the distribution and generating polling stations with near perfect attendance. But, the "hump" near 100% is suspicious as the tail should be much smaller.
If we look at the distribution of votes for Ilham Aliyev and his main challenger, Camil Hasanli, alongside turnout at the polling-station level, Aliyev tends to perform better where turnout is higher. In an earlier post on Armenia's election, I noted that the relationship between turnout and performance was quite striking: the regime's preferred candidate secured a higher vote proportion at higher levels of turnout whereas the main challenger's totals were smaller at higher levels of turnout. The results are positively correlated for Aliyev (0.334, significant a the .001 level) and negatively for Hasanli (-0.050, significant at the .001 level). These outcomes could be explained by strong mobilization efforts or by illicit actions. It is especially notable that President Aliyev did not receive under 50% in any polling station.
Invalid ballots are related to turnout, especially if one adopts a more sinister interpretation of high turnout. If ballot boxes are being stuffed, they are not being stuffed with invalid ballots, but rather those that help the preferred candidate. Just over 40% of the polling stations in Azerbaijan reported no invalid ballots. While no research precisely identifies the "natural" level of invalidation in a democratic election,** it is not uncommon for voters to make mistakes rendering their ballots invalid. The absence of invalid ballots in 40% of polling stations is notable.
Forensics
Election forensics rely on expectations about the distribution of digits in naturally occurring data, and assumptions about human behavior,*** to provide some insights into anomalous results. My colleague Fredrik Sjoberg posted the following figure on Twitter, noting that the distribution of last digits suggests human intervention. The general expectation is that the last digits should be uniformly distributed, but zeros are inflated in the data from Azerbaijan.
If we look at the last two digits, the expectations and results are similar. The last digit combination of 1-0 is especially high given expectations (whereas we would anticipate 1-0 to appear in around 1% of the results, it instead appears around 7% of the time).
This outcome is likely driven, at least in part, by the marginal candidates who receive just a few votes in any given polling station. Eyeballing the data, one can notice some outcomes that appear to be peculiar, such as the frequency with which minor candidates receive the same results in some regions. For instance, if one looks at the data from District 1 in Nakhchivan, the consistency of the vote across many polling stations is notable, especially where the final three candidates receive 10, 11, and 6 votes. This is essentially an anecdotal presentation of some data, and it could be produced by chance or nature (humans seek out patterns, and randomness can produce outcomes that appear to be patterns). However, it is also notable that the results are consistent across several polling stations where the total number of votes varies - in other words, the primary variation in outcomes is the amount allocated to Hasanquliyev and Aliyev (Hasanli, the opposition candidate, receives few votes here).
What are the take-aways from the preliminary data?
=====================================================================
* The OSCE generally has delegations large enough to gather samples across a country's territory, conducts training so that observer activities should be relatively consistent, and has a thorough questionnaire that provides the data used for the assessment. Observers are not deployed randomly, however, and the convenience sample may over-represent urban areas and problematic polling stations.
** Invalidation rates depend on many factors, including ballot design and the electoral system.
*** Most notably, the expectation is that humans are not especially talented at falsifying data. Instead of creating digits randomly, they fall into patterns that suggest manipulation. I have discussed Benford's Law and its applications in previous posts, and the basics apply here as well.
In this post, I return to a few questions that I posed on election eve and provide a preliminary assessment of the data. OSCE reports, which tend to be based on the most thorough data collection efforts among international observation organizations,* suggest that fraud was evidenced among officials in the election apparatus, and also among citizens via vote buying and other forms of improper voting.
Turnout
Turnout not only provides a sense of citizen participation, but can also provide some evidence of malfeasance. If ballot boxes are being stuffed, or voters are being directed in "carousels", turnout will be inflated. The official turnout at the national level was 72.31%, according to the CEC. The average turnout at the polling station level was 74.4%. Of the 5,492 polling stations, 68 (1.2%) reported 100% turnout and 177 (3.2%) reported 95% or higher turnout. These results are consistent with the 2008 presidential elections.
 |
| Turnout Across Election Day Reporting Periods, CEC Data |
The figure above shows the distribution of turnout across all polling stations at each reporting period on election day. At 10:00 a.m. and at noon, the distributions are bimodal, with the major mode centered around 20% and 40%, and minor modes around ten percentage points lower. As the day progresses, the distributions smooth out. The most interesting transformation is between 5:00 pm and the close of the polling stations at 7:00 p.m. The mean at closing is slightly higher than at 5:00 pm, but variance increases and a "hump" appears close to 100%. Could all of these changes happen naturally? Many of them could, especially if voters continued to come to the polls throughout the day. My cursory scan of webcams in the late afternoon showed little activity, but I was not able to systematically assess traffic. In principle, voters could have continued coming to the polls, altering the distribution and generating polling stations with near perfect attendance. But, the "hump" near 100% is suspicious as the tail should be much smaller.
 |
| Proportion of the Vote by Turnout, Aliyev and Hasanli |
If we look at the distribution of votes for Ilham Aliyev and his main challenger, Camil Hasanli, alongside turnout at the polling-station level, Aliyev tends to perform better where turnout is higher. In an earlier post on Armenia's election, I noted that the relationship between turnout and performance was quite striking: the regime's preferred candidate secured a higher vote proportion at higher levels of turnout whereas the main challenger's totals were smaller at higher levels of turnout. The results are positively correlated for Aliyev (0.334, significant a the .001 level) and negatively for Hasanli (-0.050, significant at the .001 level). These outcomes could be explained by strong mobilization efforts or by illicit actions. It is especially notable that President Aliyev did not receive under 50% in any polling station.
Invalid ballots are related to turnout, especially if one adopts a more sinister interpretation of high turnout. If ballot boxes are being stuffed, they are not being stuffed with invalid ballots, but rather those that help the preferred candidate. Just over 40% of the polling stations in Azerbaijan reported no invalid ballots. While no research precisely identifies the "natural" level of invalidation in a democratic election,** it is not uncommon for voters to make mistakes rendering their ballots invalid. The absence of invalid ballots in 40% of polling stations is notable.
Forensics
Election forensics rely on expectations about the distribution of digits in naturally occurring data, and assumptions about human behavior,*** to provide some insights into anomalous results. My colleague Fredrik Sjoberg posted the following figure on Twitter, noting that the distribution of last digits suggests human intervention. The general expectation is that the last digits should be uniformly distributed, but zeros are inflated in the data from Azerbaijan.
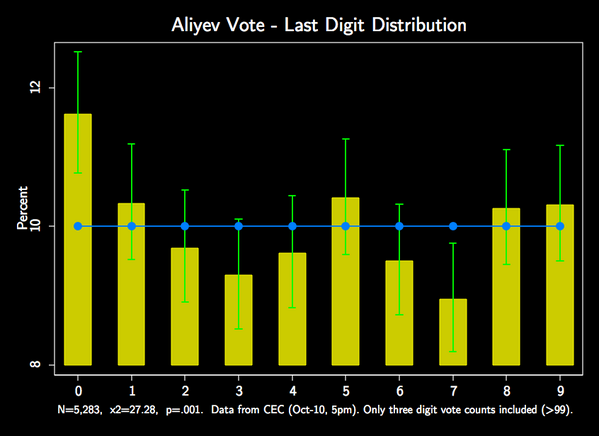 |
| Fredrik Sjoberg's Last Digit Analysis via Twitter @fsjoberg |
 |
| Distribution of the Last Two Digits |
 |
| Polling Station Results for District 1 in Nakhchivan |
Nakhchivan is a special place as I have noted before, and has produced unusual election results. But, a deeper spatial analysis will have to wait. My current map of Azerbaijan's districts that I developed for the last election is no longer accurate since some of the district areas have been re-drawn. I hope to have a chance to develop a new shapefile to display some of the data spatially, but it must wait for other projects to be completed first.
What are the take-aways from the preliminary data?
- Election day turnout displays some unusual outcomes, notably the "hump" at the tail of the distribution. The distribution shows an elevated concentration of polling stations with perfect or near-perfect turnout.
- Higher turnout is associated with a higher proportion of the vote for President Aliyev, and with poorer outcomes for Hasanli. This is consistent with mobilization and/or illicit methods.
- Election forensics show that the last digit and last two digits are not distributed as anticipated (with the expectation being a uniform distribution). These outcomes are consistent with human intervention.
=====================================================================
* The OSCE generally has delegations large enough to gather samples across a country's territory, conducts training so that observer activities should be relatively consistent, and has a thorough questionnaire that provides the data used for the assessment. Observers are not deployed randomly, however, and the convenience sample may over-represent urban areas and problematic polling stations.
** Invalidation rates depend on many factors, including ballot design and the electoral system.
*** Most notably, the expectation is that humans are not especially talented at falsifying data. Instead of creating digits randomly, they fall into patterns that suggest manipulation. I have discussed Benford's Law and its applications in previous posts, and the basics apply here as well.

